Introduction
The fluctuations in oil prices are a critical indicator of global economic health and energy policy direction. Understanding the oil price chart is essential for investors, policymakers, and consumers alike. Influenced by various factors like geopolitical events, supply and demand, and market speculation, oil prices can impact everything from fuel costs to inflation rates.
Recent Trends in Oil Prices
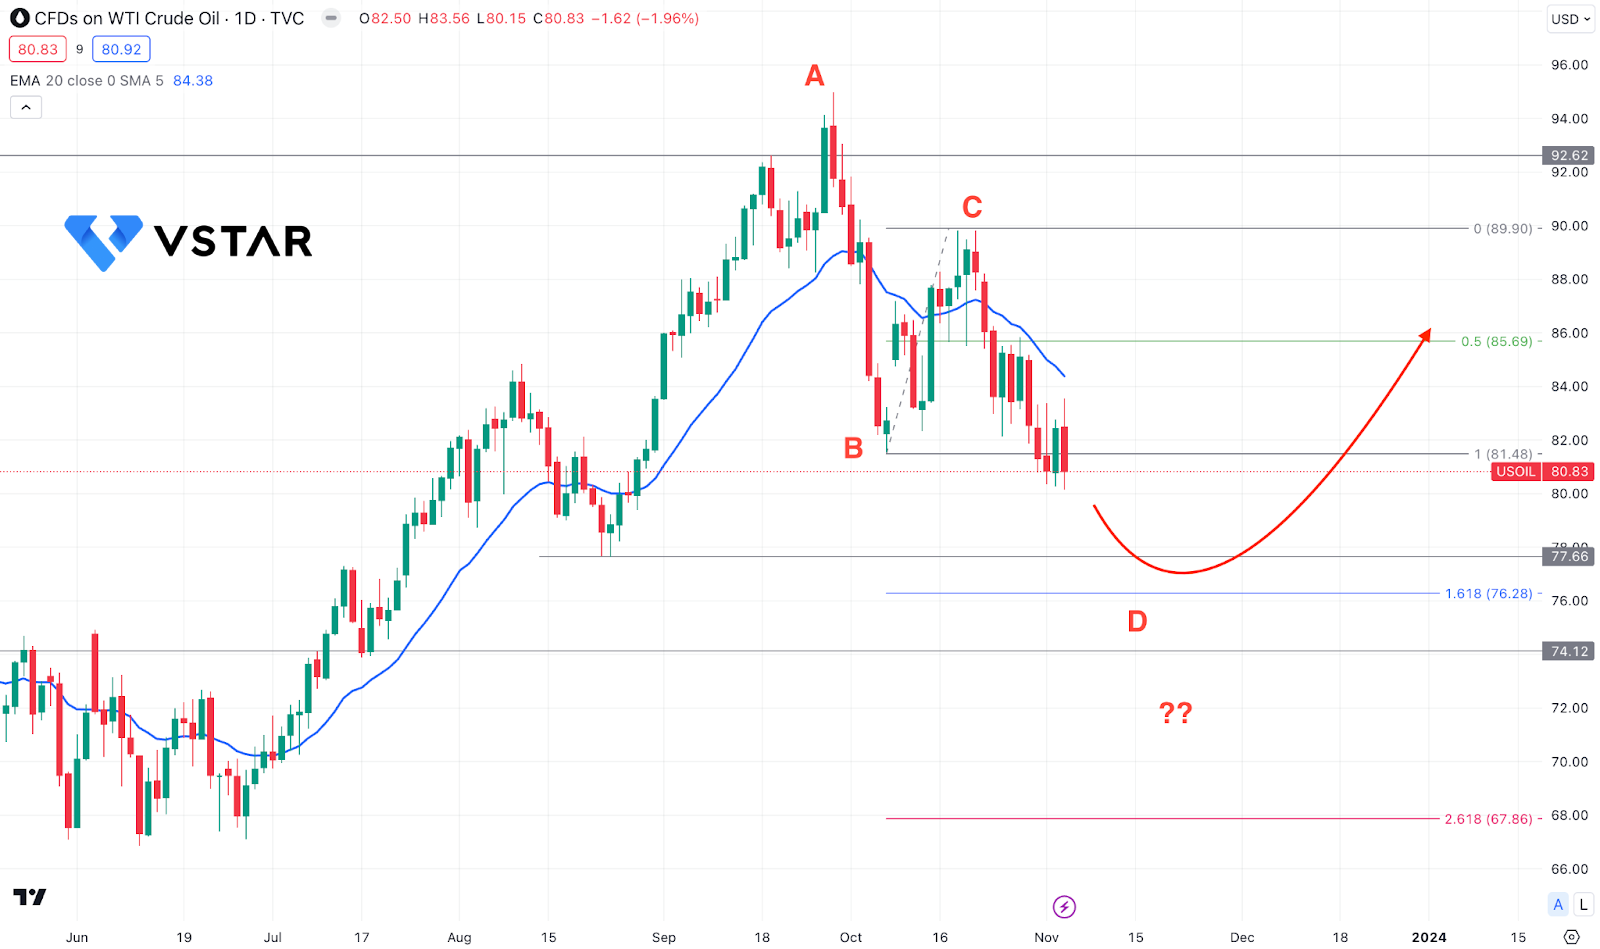
As of October 2023, oil prices have shown significant volatility. According to the latest data from the US Energy Information Administration (EIA), the West Texas Intermediate (WTI) crude oil price fluctuated between $70 and $85 per barrel over the past month. Factors contributing to this volatility include supply chain disruptions following COVID-19, OPEC+ production decisions, and ongoing geopolitical tensions in key oil-producing regions.
In early October, prices surged due to ongoing tensions in the Middle East, as conflicts raised concerns about potential disruptions to crude oil supply routes. Analysts observed that the oil price chart reflected a steep increase, rising nearly 10% in a week. This sudden spike prompted increased scrutiny from market analysts who are now forecasting prices could reach $100 per barrel if geopolitical tensions escalate further.
Impact of Oil Price Changes
The oil price chart is not just a reflection of market trends; it has wide-reaching implications for the global economy. Higher oil prices often lead to increased costs for transportation and goods, which can, in turn, stoke inflation across various sectors. Conversely, lower oil prices can enhance consumer spending as fuel costs drop, but they may also signal economic slowdown, particularly for oil-dependent countries.
Looking Ahead
Analysts are divided on the future trajectory of oil prices. Some anticipate that ongoing efforts to diversify energy sources coupled with the shift to renewables could stabilise prices in the long run. On the other hand, persistent geopolitical tensions and natural disasters affecting production could lead to further surprises in the oil price chart.
Conclusion
Understanding the nuances of the oil price chart is vital for anyone engaged in economic planning, energy policy, or investment strategy. As we move forward, stakeholders must remain vigilant, keeping an eye on global events and market signals to navigate the complexities of oil prices. The current climate suggests a potential for turbulent times ahead, making it imperative for consumers and businesses alike to stay informed.
You may also like